Dashboards & reports that give the whole picture
Marketing dashboards pull your scattered numbers into one live view: GA4, Google Ads, Meta and Search Console, side by side, showing what you spent and what it returned. We build them in Data Studio for NZ businesses tired of logging into five platforms to answer one question. Live, shared and readable by humans.
Why most marketing reporting fails its reader
Marketing reporting usually fails in one of two ways. Either it's a monthly PDF of platform screenshots that arrives too late to act on, or it's a dashboard with forty charts that answers everything except the question that matters: is this working, and what did it cost?
The problem underneath is that every platform grades its own homework. Google Ads claims a sale, Meta claims the same sale, GA4 says something different again, and none of them volunteer the combined picture. Left separate, the numbers flatter each channel and mislead the person paying for all of them.
A good dashboard fixes both problems at once. It puts spend and revenue from every channel in one place, on one set of definitions, updating live. The morning question, how are we doing, gets a thirty-second answer instead of five logins and a spreadsheet.
One dependency worth naming: a dashboard is only as honest as the data feeding it. If the tracking underneath is broken, the dashboard just makes bad numbers look organised. That's why this service pairs with our GA4 and tracking setup work, and why we check the foundations before we build on them.
Our dashboard and reporting services
Dashboards are one half of our analytics offering, sitting on top of the measurement our GA4 and tracking setup service gets right. Every TooGood client gets a live dashboard as standard; this page is for businesses who want one regardless of who runs their marketing.
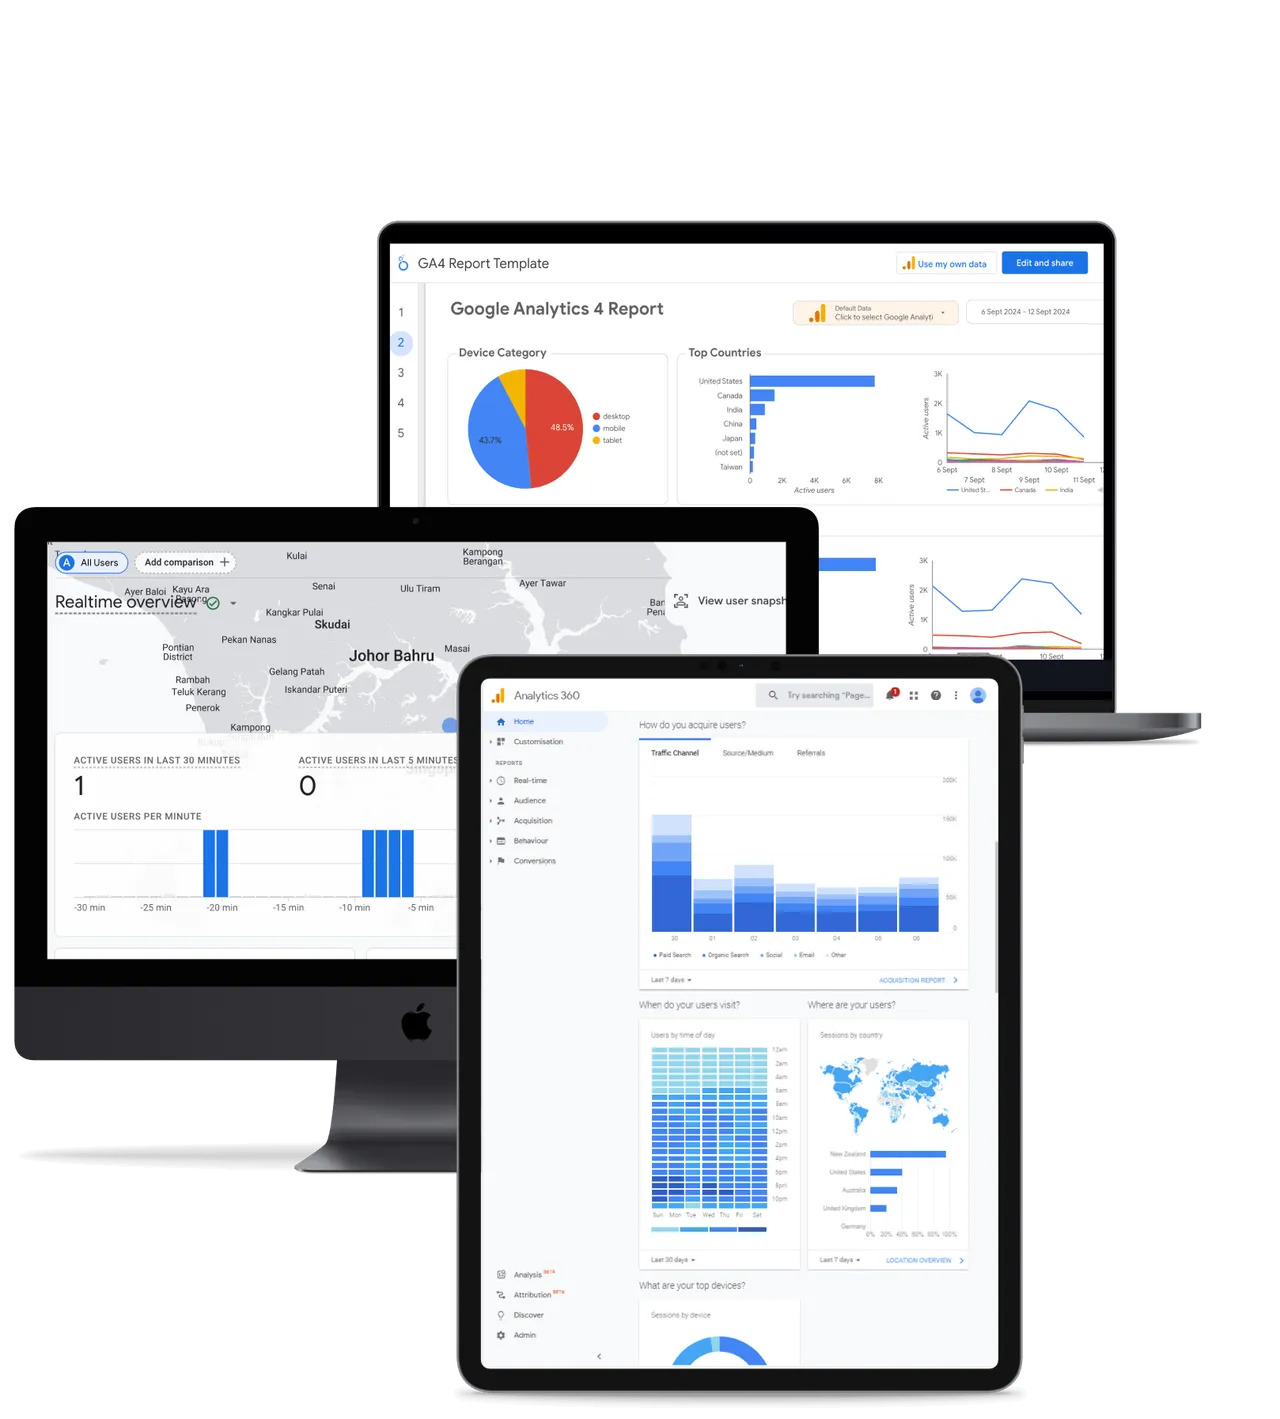
Data Studio & custom dashboards
All your sources, one view
Reports around your questions
Commentary & review
Why have TooGood build your reporting?
Dashboards are easy to make and easy to make meaningless. The difference:
The whole point of the dashboard is to prove what your marketing returned in real sales and leads, attributed to the channels that earned them. Blended truth over platform-claimed vanity metrics.
Honesty is built into the dashboard, not bolted on. Underperformance shows up in plain sight, platform claims get reconciled against reality, and nothing is cherry-picked. Transparency for you, and for the world.
The dashboard lives in your accounts, documented, and keeps working if we ever part ways. We don't lock clients in with contracts or hostage reporting. The work does that for us.
Regular catch-ups, a live dashboard you can open any time, and open communication mean the numbers are never a mystery you wait a month to see.

Good.
Reporting built to be read, not just sent.
The reporting stack we work in
Data Studio is the centre: free, live and shareable, with native connections to GA4, Google Ads and Search Console. Meta and other sources connect through established connector tools where they're needed. When a client wants something more tailored, we also build custom dashboards with AI.
Where a business has grown past connector territory into warehouses and custom pipelines, that's genuine data engineering. We'll say so plainly and help you scope it, rather than stretching a reporting tool past what it honestly does.
 Google Ads
 Analytics
 Tag Manager
 Meta
Meta Instagram
 Klaviyo
 Shopify
 WordPress
How our dashboard builds work
We start with what you need to know and who needs to know it. The owner, the marketer and the board read differently, and the dashboard is designed around those readers.
We verify the sources before connecting them: GA4 configuration, conversion definitions and ad platform tracking. Broken inputs get flagged and fixed before they get visualised.
The dashboard gets built, then walked through with you and sharpened. The first version always surfaces new questions; the second version answers them.
Platforms change and businesses change focus. We keep the dashboard maintained and the definitions current, and where you want it, we add monthly commentary and a review call.
Reporting for your business type
The right dashboard depends on what a result means in your business. We design for that.
Ecommerce
Revenue, ROAS and channel mix in one view, blended honestly across platforms.
Learn more →Business typeLead Generation
Cost per qualified lead and pipeline value, not just form-fill counts.
Learn more →IndustryHealthcare
Clinics and practices growing patient bookings.
Learn more →IndustryDentists
Dental practices filling chairs and winning high-value cases.
Learn more →IndustryBeauty & Wellness
Beauty brands, salons and clinics.
Learn more →IndustryTrades & Home Services
Trades and home service businesses winning local jobs.
Learn more →IndustryConstruction
Builders and developers winning high-value project enquiries.
Learn more →IndustryReal Estate
Agents and agencies winning appraisals, listings and buyers.
Learn more →IndustryTourism & Hospitality
Direct bookings against OTA share, tracked season over season.
Learn more →IndustryFinancial Services
Application and acquisition reporting a board can read unassisted.
Learn more →Don't see your sector?
Every business has ten numbers that matter. We find yours and put them on one page.
See all industries →Let's get you one clear view
Tell us what you're running and how you get your numbers today. We'll show you what one honest dashboard would replace.
Frequently asked questions
Common questions about marketing dashboards, Data Studio and honest reporting.
Our digital marketing blog
We share what we learn about analytics and digital marketing on our blog, including the tactics most agencies keep to themselves.